
XAUUSD การวิเคราะห์กลยุทธ์ฉบับเต็ม 1 มิถุนายน 2569 โดยอิงจากข้อมูลกราฟ และ ออปชั่นสัญญาซื้อขายล่วงหน้าทองคำ GC1!
คำเตือน: การลงทุนมีความเสี่ยง เนื้อหาดังต่อไปนี้เป็นเพียงบทความการวิเคราะห์ข้อมูลกราฟ ไม่ใช่การชักนำชี้นำการลงทุน
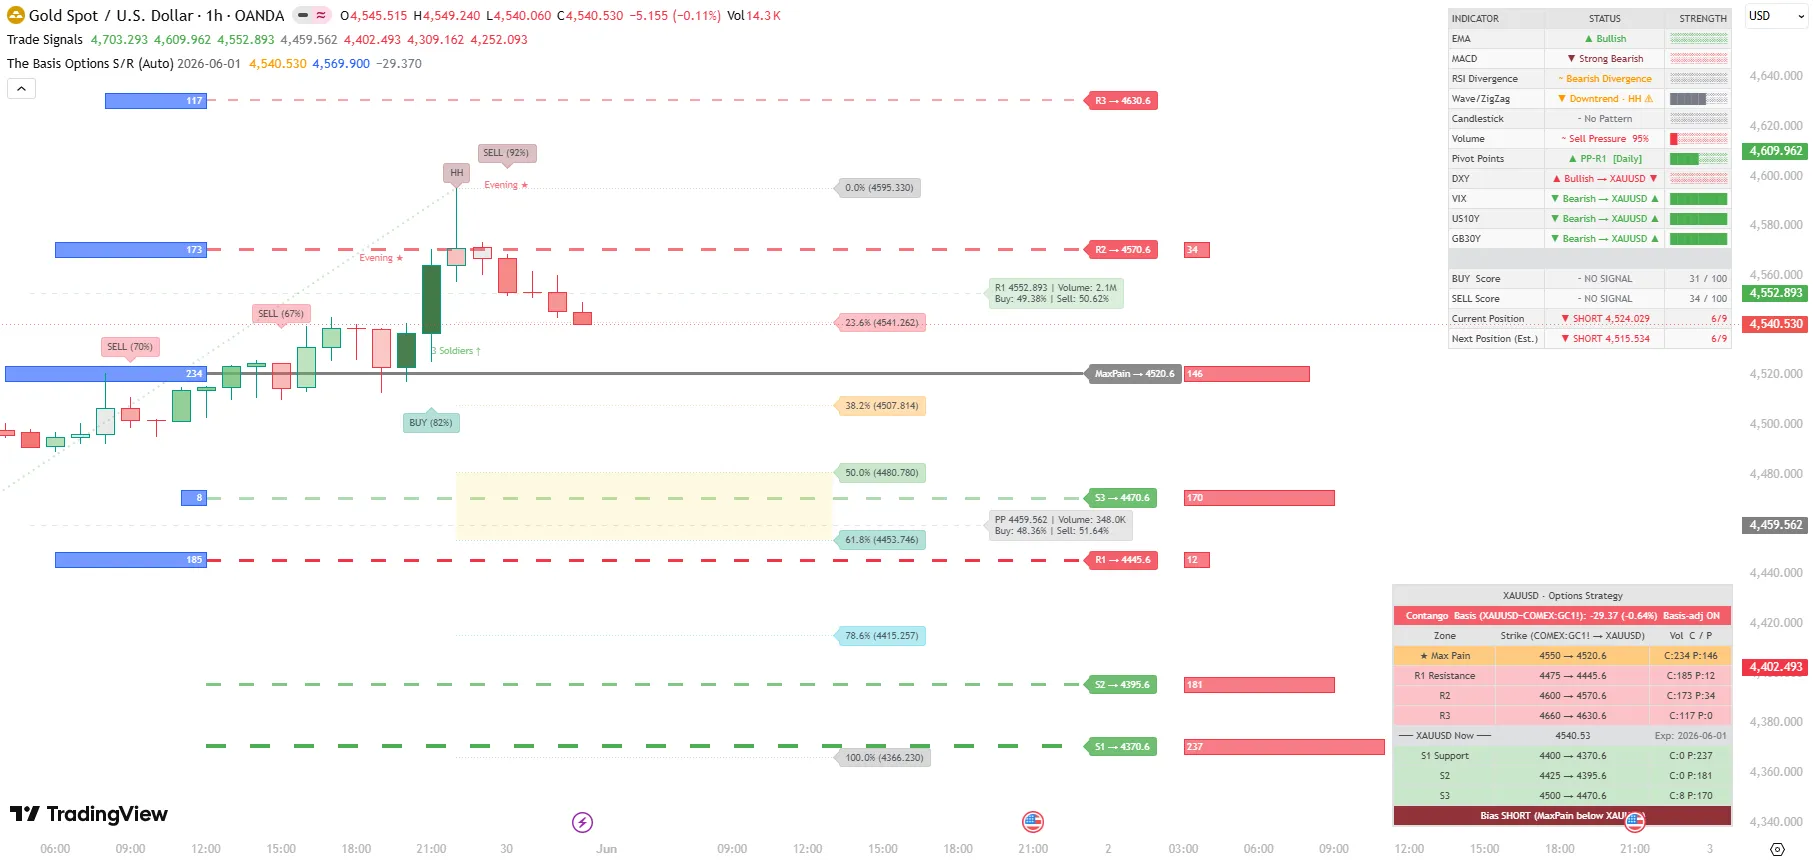
Spot: 4,540.53 | GC1! Futures: ~4,569.90 | Basis: -29.37 | 1 DTE
เวลา: 10:21 UTC+7 (Tokyo Late / London Pre-market)
Key Signals
Options Gamma Signal (สำคัญที่สุด)
★ Max Pain GC 4,550 → Spot 4,520.6
Current Spot 4,540.53 = อยู่เหนือ Max Pain +19.93 pts
→ GAMMA GRAVITY ดึงลง = ▼ BEARISH
→ 1 DTE = Gamma Effect แรงสูงสุด วันนี้เท่านั้น!
Technical Signals
| Indicator | Status | Meaning |
|---|---|---|
| EMA | ▲ Bullish | EMA ยังพยุงราคา |
| MACD | ▼ Strong Bearish | Momentum หันลง |
| RSI | ~ Bearish Divergence | ราคา HH แต่ RSI ไม่ตาม = Exhaustion |
| Wave/ZigZag | ▼ Downtrend HH | ยืนยัน Lower High Pattern |
| Volume | ~ Sell Pressure 95% | Institutional Selling สูงสุด |
| DXY | ▲ Bullish → XAUUSD ▼ | Dollar แข็ง กดทอง |
Institutional Flow (Volume ที่ Pivot Levels)
ข้อมูลปริมาณการซื้อขายย้อนหลัง 3 สัปดาห์
- R1 4,552.893 → Vol 2.1M Buy 49.4% / Sell 50.6% ← สมดุล/เล็กน้อย Sell
- R2 4,609.962 → Vol 777K Buy 53.9% / Sell 46.1% ← Buyers แถวนั้น
- R3 4,703.293 → Vol 1.8M Buy 46.5% / Sell 53.6% ← Sellers มาก
- PP 4,459.562 → Vol 348K Buy 48.4% / Sell 51.6% ← สมดุล Sell เล็กน้อย
- S1 4,402.493 → Vol 187K Buy 58.5% / Sell 41.5% ← Buyers เยอะ (Floor)
สถาบันซื้อที่ S1 (4,402) และขายที่ R1-R2 = ยืนยัน Range Bound + Sell High
Key Levels Jun 01, 2026
4,630.6 ━━━━ R3 | GC 4,660 | C:117 P:0 (Call Ceiling)
4,595.3 ━━━━ 0.0% Fib | HH High (Fake Breakout)
4,570.6 ━━━━ R2 | GC 4,600 | C:173 P:34 (Call Wall)
4,552.9 ━━━━ R1 Pivot Daily (Vol 2.1M ต่อสู้กัน)
4,541.3 ━━━━ 23.6% Fib
═══════════════════════════════════════
4,540.5 ← ⚡ ราคาปัจจุบัน
═══════════════════════════════════════
★ 4,520.6 ━━━━ MAX PAIN | GC 4,550 | C:234 P:146 (OI:380)
4,507.8 ━━━━ 38.2% Fib
4,480.8 ━━━━ 50.0% Fib
4,470.6 ━━━━ S3 | GC 4,500 | C:8 P:170 (Put Support)
4,453.7 ━━━━ 61.8% Fib
4,445.6 ━━━━ R1 Options | GC 4,475 | C:185 (ITM Hedge Floor)
4,415.3 ━━━━ 78.6% Fib
4,395.6 ━━━━ S2 | GC 4,425 | C:0 P:181
4,370.6 ━━━━ S1 | GC 4,400 | C:0 P:237 (Major Put Floor)
4,366.2 ━━━━ 100% Fib
Strategy
PRIMARY — SELL toward Max Pain (โอกาสสูงสุด)
เหตุผล: 1 DTE Gamma Gravity + Sell Pressure 95% + MACD Bearish + RSI Divergence
| Entry Zone | 4,541 – 4,553 | (ปัจจุบัน / R1 Pivot Reject) |
| Stop | 4,563 – 4,572 | (เหนือ R2 Call Wall) |
| Target 1 | 4,520.6 | ★ Max Pain (ปิด 60%) |
| Target 2 | 4,470.6 | S3 Put Support (ปิด 30%) |
| Target 3 | 4,445.6 | ITM Hedge Floor (ปิด 10%) |
| RR | 1:2.5 – 1:3.5 | |
| Confirm | H1 ปิดใต้ 4,535 + Volume Sell Spike ต่อ |
SECONDARY — BUY ที่ Max Pain Bounce
เหตุผล: S3 Put Wall + 50% Fib ใกล้กัน + Volume S1 แสดง Institutional Buy
| Entry Zone | 4,518 – 4,522 | (Max Pain Zone) |
| Stop | 4,508 | (ใต้ 38.2% Fib) |
| Target 1 | 4,540 | (เดิม) |
| Target 2 | 4,552 | (R1 Pivot) |
| RR | 1:2.0 | |
| Confirm | Bullish Candle H1 + Buy Volume surge ที่ 4,520 |
RISK — BUY Breakout (ถ้า Scenario เปลี่ยน)
หาก R2 (4,570.6) ถูกทะลุขึ้นพร้อม Volume สูง = Short Squeeze
| Entry Zone | 4,573 – 4,575 | |
| Stop | 4,558 | |
| Target | 4,595 → 4,630 | |
| Target 2 | 4,552 | (R1 Pivot) |
| RR | 1:2.0 |
Summary
BIAS: BEARISH SHORT
Max Pain Target: 4,520.6 (Gravity ดึงแรงสุด)
กรอบวัน: 4,445 – 4,555
Gamma Effect: MAXIMUM (1 DTE วันนี้วันเดียว!)
- Sell Zones (ลำดับความสำคัญ):
- 4,540–4,553 ← ตรงนี้ตอนนี้ (Best Entry)
- 4,570–4,572 ← ถ้า bounce ขึ้นก่อน
- Buy Zones:
- 4,518–4,522 ← Max Pain Bounce
- 4,468–4,472 ← S3 Put Wall Bounce
Hard Floor: 4,370.6 (Put 237 = ห้ามลงทะลุง่าย)
Hard Ceiling: 4,570.6 (Call 173 = กดแรง)
Others
- Institutional Game Plan วันนี้:
- สถาบันที่ SHORT GC Calls ที่ 4,550 (234 lots) → ต้องการให้ราคาอยู่ ต่ำกว่า 4,550 GC (~4,520 spot) ณ Expiry เพื่อเก็บ Premium ครบ
- สถาบันที่ LONG ITM Calls 4,475 GC (185 lots) → มี Delta Hedge Futures อยู่ → ถ้าราคาลงจะ Unwind Hedge = ขาย Futures → กดราคาเพิ่ม
- Time-based Risk:
- 10:00–14:00 UTC+7 → Tokyo Close / Ranging Low Volume
- 14:00–17:00 UTC+7 → London Open = Breakout Risk
- 19:00–23:00 UTC+7 → NY Open = Volatility สูงสุด
- ~21:30 UTC+7 → Expiry Pin Effect แรงสูงสุด
- Pattern Alert:
- Evening Star ที่ HH = Reversal Pattern แม่นยำสูง
- 3 Soldiers ที่ Low = Short-term Bounce ก่อน Continue Down
- ราคาอาจ Bounce ถึง 4,545–4,552 ก่อน แล้วค่อย DROP ลง Max Pain
Trad Signals Indicator – Auto-Adaptive Confluence System Indicator